Reading Forecasts
Empirical automatically generates a forecast for each of your project’s epics using a Monte Carlo simulation with thousands of iterations. The results are aggregated into a chart that shows the probability of completing an epic on or before a given date:
Authentication System Overhaul
100% chance to deliver by Jan 31
This gives you and your stakeholders a clear way to articulate the confidence that you’ll ship by a certain date.
Epic Statuses
Epics with due dates set are automatically color coded green, yellow or red based on their chance to complete by their due date.
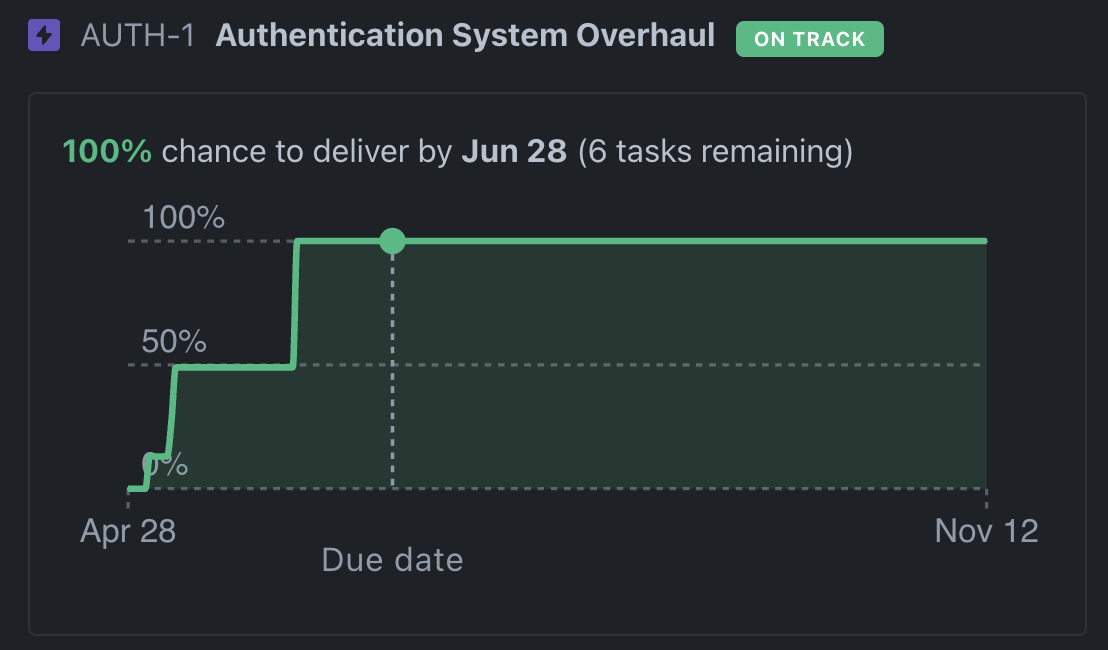
On track
Epics with an 85%+ chance to complete by their due date are labeled “On track” and colored green.
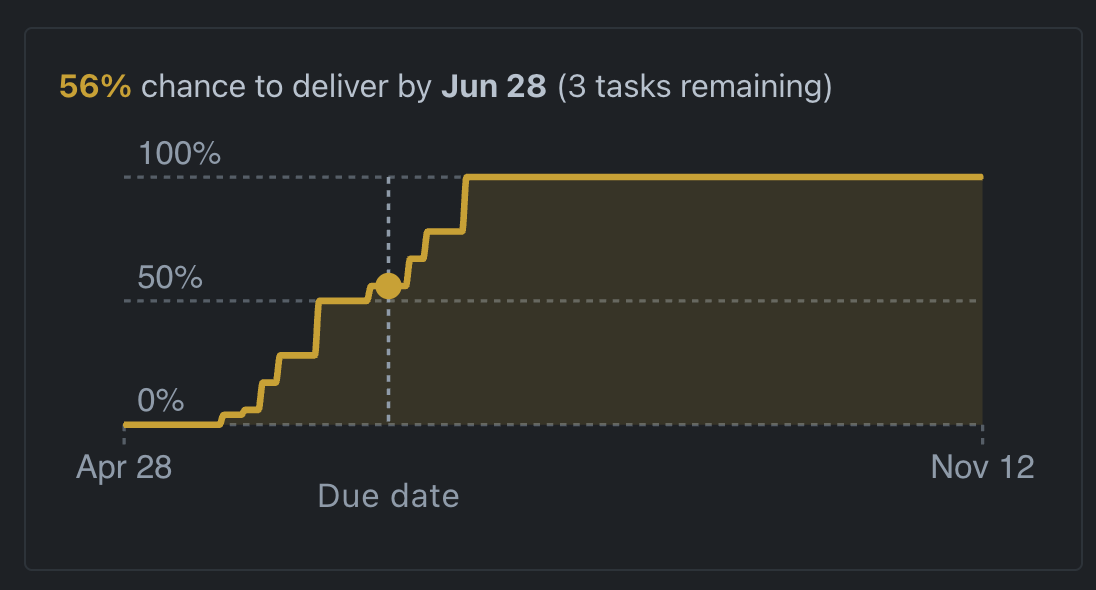
At risk
Epics with a 51-84% chance to complete by their due date are labeled “At risk” and colored yellow.
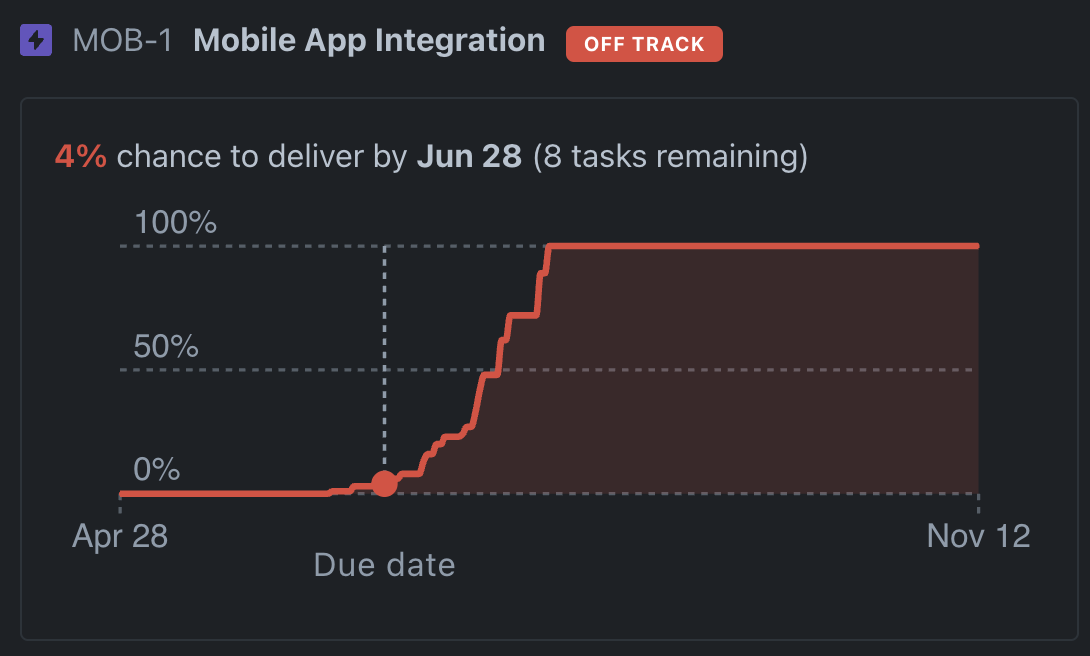
Off track
Epics with a 50% or less chance to complete by their due date are labeled “Off track” and colored red.